Interactive Climate Change Tools Canada
Published by Rylan Urban on Nov 6, 2019. Last updated by Rylan and Chloe McElhone on Aug 9, 2023.
This page contains links to interactive climate change tools including climate models, policy and indicator trackers, and impact explorers that you can use to better understand climate change in Canada.
Students, policy makers, and others can use these tools as a starting point for developing climate change mitigation, adaptation, and resilience strategies, or for performing climate scenario analyses.
Interactive Climate Models
These climate change modeling tools allow users to visualize how various climate variables (temperature, rainfall, flooding, etc.) might change under different global warming scenarios.
The Climate Atlas of Canada provides good localized and regional insights while the IPCC and World Bank tools provide strong country-level insights from around the globe.
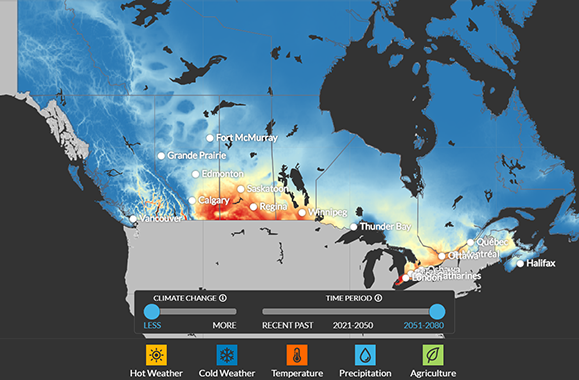
Climate Atlas of Canada
The Climate Atlas of Canada allows you to explore how temperature, precipitation, and agricultural variables may change under two global warming scenarios (RCP 4.5 and RCP 8.5) at the regional level.
Interested users can also explore an expanded set of climate variables at the local level under three warming scenarios (RCP 2.6, RCP 4.5, RCP 8.5) using the Climate Data Explorer.
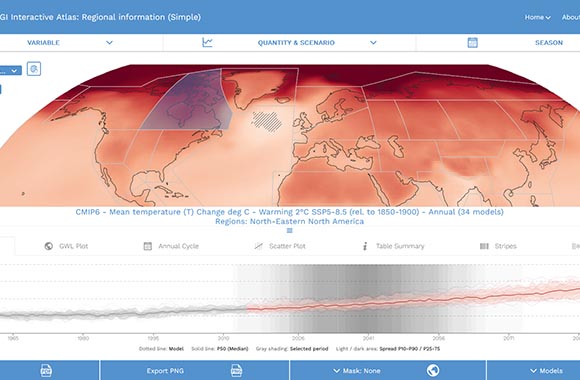
IPCC WGI Interactive Atlas
The IPCC WGI Interactive Atlas allows you to explore temperature, precipitation, ocean, and other climate variables using several data sets and scenarios (including RCP 2.6, RCP 4.5, and RCP 8.5).
This visualization tool is less granular than the Climate Atlas of Canada, but it offers unique spatial boundaries (Canadian river basins and oceans) not available in the Atlas.
Similar tools: U.S. Resilience Toolkit The Climate Explorer; Climate Analytics Climate Impact Explorer
WB Climate Change Knowledge Portal
The World Bank Climate Change Knowledge Portal is a similar tool that visualizes climate models at the provincial level.
However, the World Bank portal also offers good commentary for those new to climate change.
Climate Policy Trackers
These climate and energy policy indicator tracking tools allow users to understand country-level performance on various climate-related indicators (policies, investments, emissions, etc.).
The Climate Action Tracker provides a good summary of Canadian policy while the Energy Policy Tracker provides a good summary of Canadian energy investments.
Climate Action Tracker
The Climate Action Tracker is a policy database that projects emissions and tracks countries’ progresses towards limiting global warming to 1.5°C. Novel analysis is available for Canada and 41 other countries.
Similar tool: Climate Analytics 1.5°C National Pathway Explorer
Related energyhub.org pages: Climate Action Plans, Clean Energy Targets
Energy Policy Tracker
The Energy Policy Tracker tracks the amount of government money committed to fossil fuels, clean energy, and other energy projects since 2020. Investment data is available for Canada, 31 other countries, and 9 multilateral institutions
Climate Indicator Trackers
These indicator tracking tools allow users to monitor Canada’s performance on various climate-related performance indicators (clean energy, emissions intensity, etc.).
The energyhub.org resource provides good provincial insights while the IMF and World Bank resources provide good national insights for Canada and other countries.
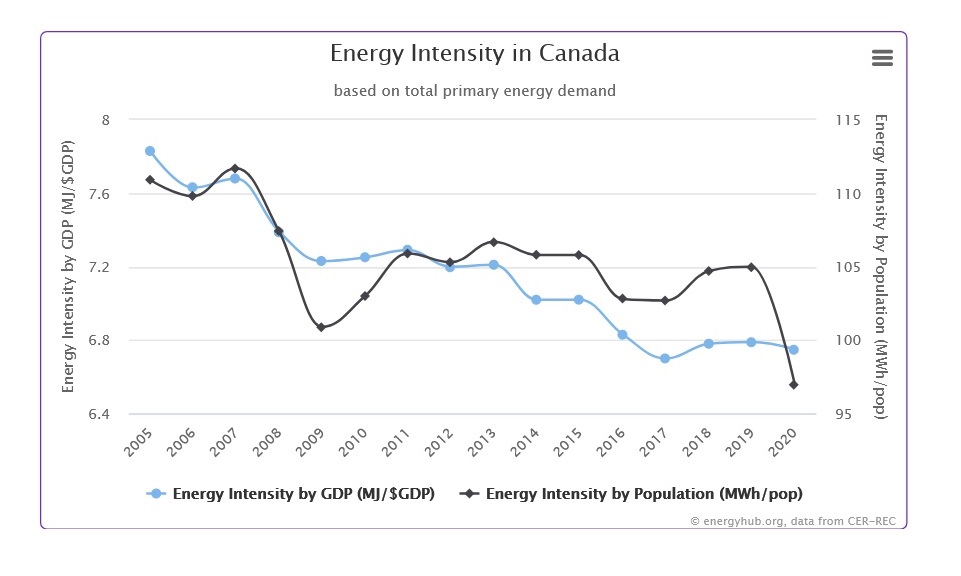
energyhub.org Sustainable Energy Indicators
The Sustainable Energy Data Indicators page on energyhub.org provides country and provincial level performance data on various indicators including energy and emissions intensity, low-carbon energy, and electrification.
Similar tools: Climate Trace, NOAA Global Monitoring Laboratory: Trends in Atmospheric Carbon Dioxide
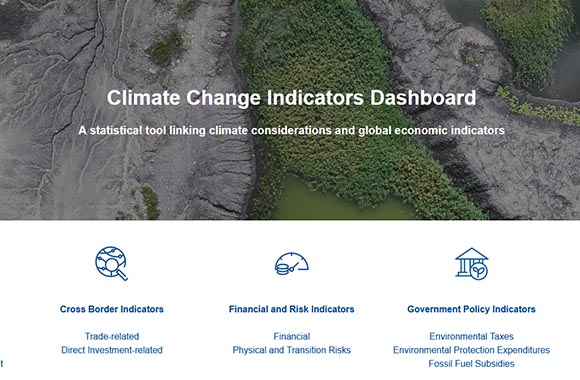
IMF Climate Change Indicators Dashboard
The IMF Climate Change Dashboard is a tool that tracks country-level performance on various climate-related economic, financial, risk, and policy indicators. Indicators are currently available for all countries.
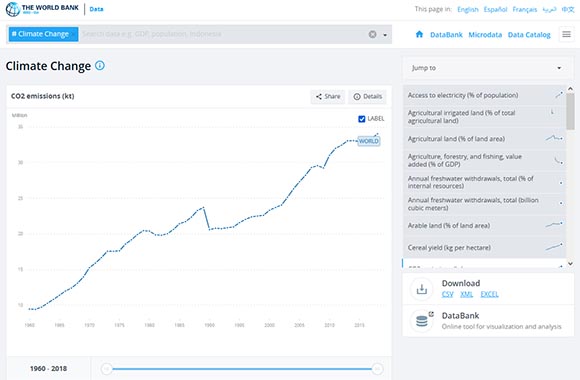
World Bank Open Data
The World Bank Open Data portal is a great source for high-level environmental, emissions, energy, and other climate-related data and indicators. Information is available at the country and global level.
Environmental Impact Explorers
These impact explorer tools also users to view the current and future environmental impacts that climate change may have in Canada and across the globe.
Google’s Environmental Insights provides localized views of emissions in select Canadian cities while Google Earth Voyager and NASA’s Global Maps explore various impacts across the globe.
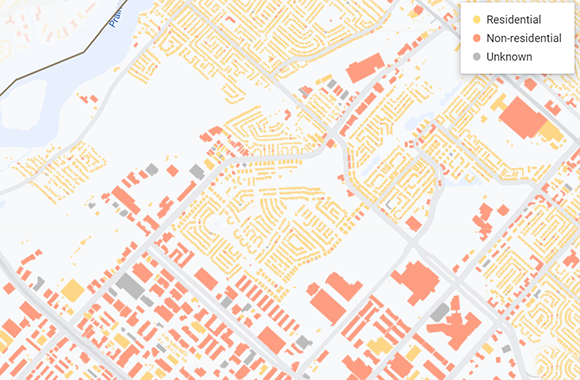
Google Environmental Insights
Google’s Environmental Insights Explorer allows you to view building and transportation emissions in select cities across Canada. Additional data is available for cities globally, including air quality and tree canopy.
Related energyhub.org pages: Solar Energy Maps, EV Charging Map
Google Earth Voyager
Google Earth’s Voyager feature offers virtual global tours on climate change impacts, ecosystems, sea-level rise, changing forests, and much more.
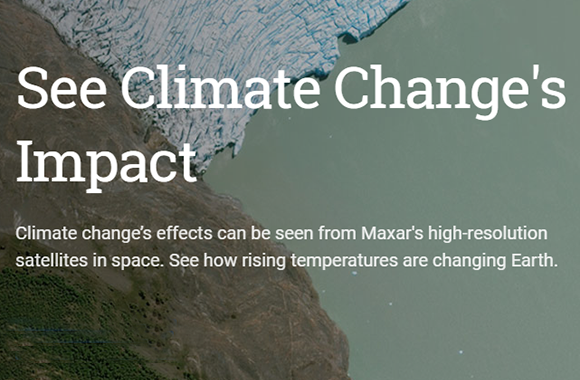
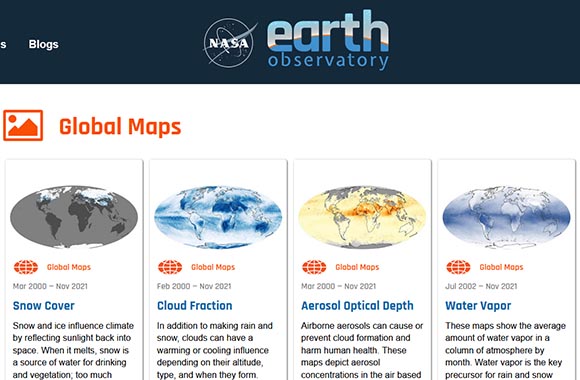
NASA Earth Observatory Global Maps
NASA’s Global Maps provide unique data visualizations for dozens of environmental and atmospheric attributes (snow cover, water vapor, vegetation, etc.) from across the globe.
💜 Do you support sustainable energy? Take action, comment below, or share this page! 💜