Solar Energy Maps Canada (Every Province)
Published by Rylan Urban on May 12, 2018. Last updated Aug 9, 2023.

National Average Solar Energy Production Potential: 1133 kWh/kW/yr
This page contains solar energy maps, along with monthly solar production estimates, for every province and territory in Canada.
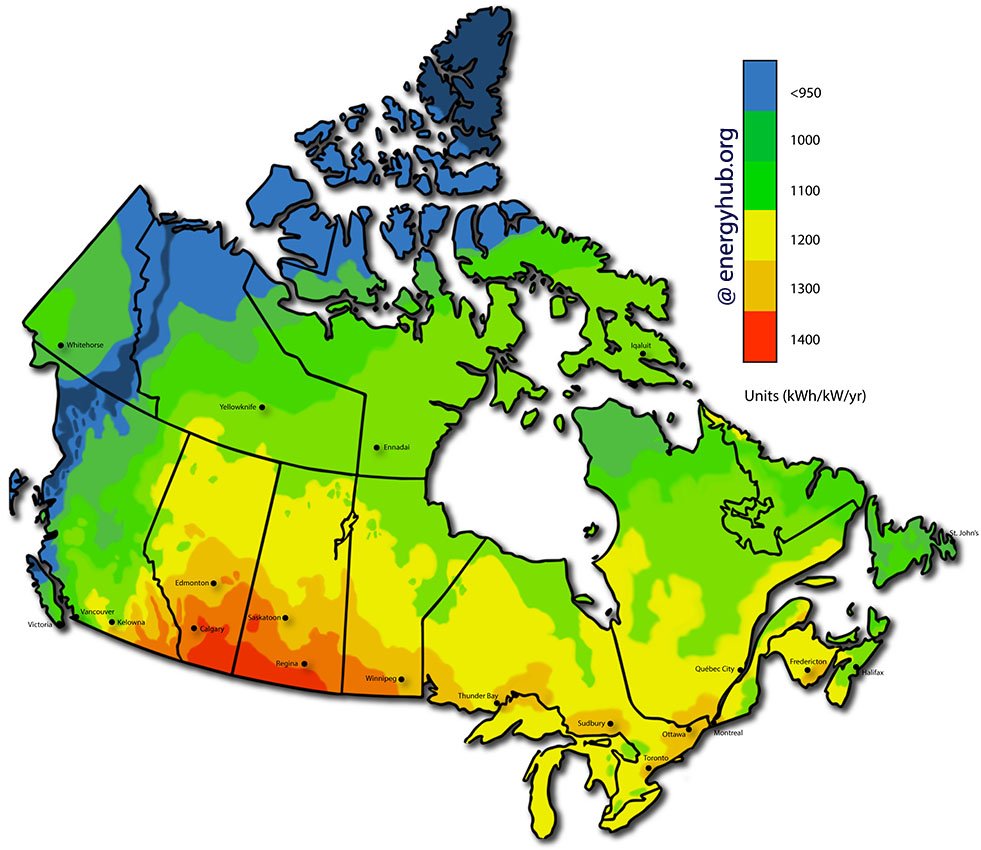
Solar energy maps show the amount of energy that a solar photovoltaic system can produce (in units of kWh/kW/yr), based on the intensity of light that reaches the Earth’s surface.
How to use Solar Energy Maps
Solar maps can be used to answer two key questions:
- Question 1: “How much energy (in units of kWh) can a solar power system (in units of kW) produce per year (yr) in my region?”
Answering this question is easy – simply look at the value on the map or find your city below!
- Question 2: “What size of solar system will I need to install (kW) to offset my annual (yr) electricity usage (kWh)?”
You can easily calculate the size of the system that you would need to offset your annual electricity usage, as well as your total system costs, by visiting our Solar Cost of Solar page.
Solar Production Potential by Province
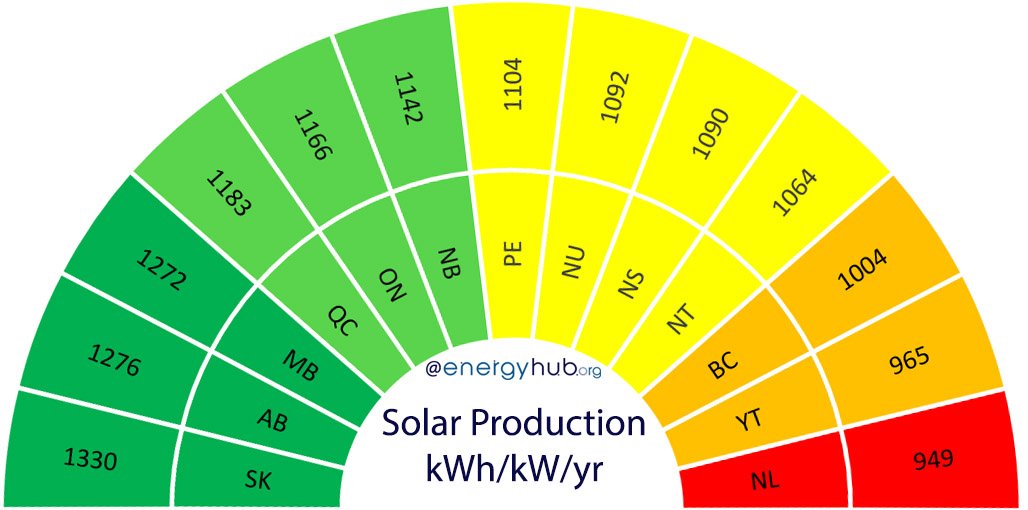
We’ve gone ahead and calculated the average solar production potential based on the five most populated cities for every province and territory in Canada.
This capacity to turn light into electricity is also a major ranking factor in our Provincial Solar Rankings.
Here is the annual average equivalent of full sunlight hours broken down by province:
| #1 Saskatchewan | 1330 kWh/kW/yr |
| #2 Alberta | 1276 kWh/kW/yr |
| #3 Manitoba | 1272 kWh/kW/yr |
| #4 Québec | 1183 kWh/kW/yr |
| #5 Ontario | 1166 kWh/kW/yr |
| #6 New Brunswick | 1142 kWh/kW/yr |
| #7 Prince Edward Island | 1104 kWh/kW/yr |
| #8 Nunavut | 1092 kWh/kW/yr |
| #9 Nova Scotia | 1090 kWh/kW/yr |
| #10 Northwest Territories | 1064 kWh/kW/yr |
| #11 British Columbia | 1004 kWh/kW/yr |
| #12 Yukon Territory | 965 kWh/kW/yr |
| #13 Newfoundland & Labrador | 949 kWh/kW/yr |
| #14 Canada Average | 1133 kWh/kW/yr |
Canada’s Best and Worst for Solar Energy
- The best provinces for producing solar energy in Canada are all located on the prairies: Alberta, Manitoba, and Saskatchewan.
This is because these provinces have relatively sunny weather all year around.
- The worst province for producing solar energy in Canada Newfoundland and Labrador, while the worst territory is the Yukon.
This is primarily because of high annual cloud cover in Newfoundland and Labrador, and a combination of high latitude (shorter summer days) and cloudy weather in the Yukon.
- The best place in Canada for producing solar power is Torquay, Saskatchewan (which has a solar energy potential of 1384 kWh/kW/yr), while the worst place is at the small research base located in Eureka, Nunavut (780 kWh/kW/yr).
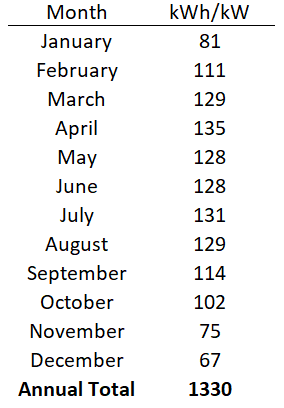
- The best month for producing solar energy in Canada is April when days are mid-length and skies are clear. The worst month for producing solar energy in Canada is December when days are short.
Provincial Solar Energy Maps
Saskatchewan
The average solar power system in Saskatchewan will produce approximately 1330 kWh of energy per kW per year.

This yearly average decreases as you move north and east in the province and increases as you move south and west. For example, a 1kW solar system in:
- Saskatoon would produce about 1,350 kWh/yr
- Regina would produce about 1,361 kWh/yr
- Prince Albert would produce about 1,300 kWh/yr
- Moose Jaw would produce about 1,363 kWh/yr
- Lloydminster would produce 1,278 kWh/yr
Alberta
The average solar power system in Alberta will produce approximately 1276 kWh of energy per kW per year.
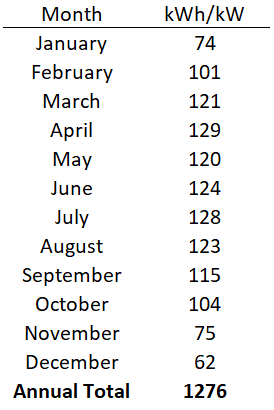

This yearly average decreases as you move north and west in the province and increases as you move south and east. For example, a 1kW solar system in:
- Calgary would produce about 1,292 kWh/yr
- Edmonton would produce about 1,246 kWh/yr
- Red Deer would produce about 1,265 kWh/yr
- Lethbridge would produce about 1,330 kWh/yr
- Sherwood Park would produce 1,246 kWh/yr
Manitoba
The average solar power system in Manitoba will produce approximately 1272 kWh of energy per kW per year.
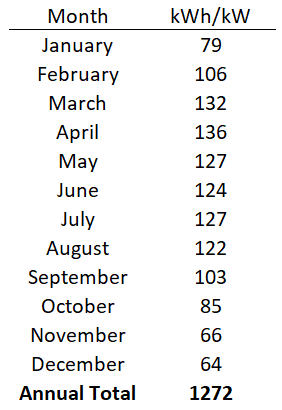

This yearly average decreases as you move north and east in the province and increases as you move south and west. For example, a 1kW solar system in:
- Winnipeg would produce about 1,281 kWh/yr
- St. Claude would produce about 1,309 kWh/yr
- Brandon would produce about 1,341 kWh/yr
- Selkirk would produce about 1,267 kWh/yr
- Dauphin would produce about 1,303 kWh/yr
- The Pas would produce 1,202 kWh/yr
Québec
The average solar power system in Québec will produce approximately 1183 kWh of energy per kW per year.
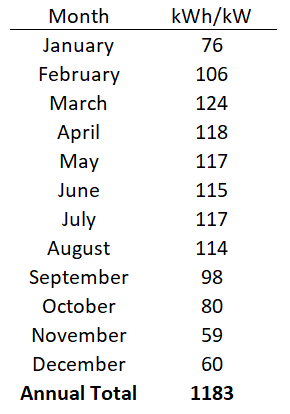

This yearly average decreases as you move north in the province and increases as you move south.For example, a 1kW solar system in:
- Quebec City would produce about 1,139kWh/yr
- Montreal would produce about 1,194 kWh/yr
- Laval would produce about 1,199 kWh/yr
- Gatineau would produce about 1,103 kWh/yr
- Longue-Pointe-de-Mingan would produce 1,278 kWh/yr
Ontario
The average solar power system in Ontario will produce approximately 1166 kWh of energy per kW per year.
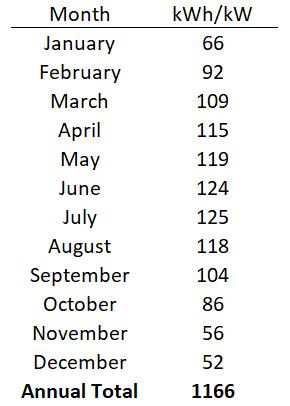

This yearly average decreases as you move north in the province and increases as you move south. For example, a 1kW solar system in:
- Toronto would produce about 1,163 kWh/yr
- Ottawa would produce about 1,199 kWh/yr
- Mississauga would produce about 1,160 kWh/yr
- Brampton would produce about 1,155 kWh/yr
- Hamilton would produce 1,152 kWh/yr
New Brunswick
The average solar power system in New Brunswick will produce approximately 1142 kWh of energy per kW per year.
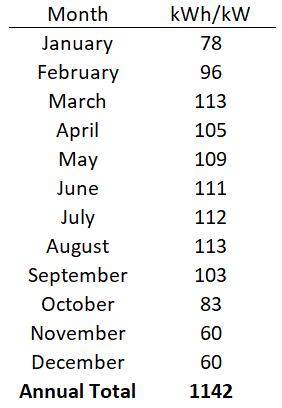

This yearly average decreases as you move north and west in the province and increases as you move south and east. For example, a 1kW solar system in:
- Moncton would produce about 1,144 kWh/yr
- Saint John would produce about 1,133 kWh/yr
- Fredericton would produce about 1,147 kWh/yr
- Dieppe would produce about 1,144 kWh/yr
- Riverview would produce 1,141 kWh/yr
Prince Edward Island
The average solar power system in Prince Edward Island will produce approximately 1104 kWh of energy per kW per year.
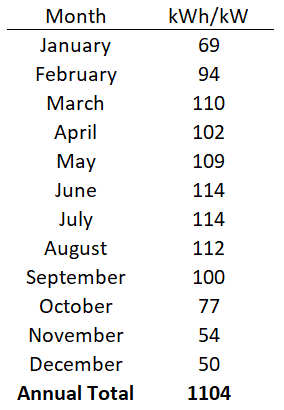

This yearly average decreases as you move east in the province and increases as you move west. For example, a 1kW solar system in:
- Charlottetown would produce about 1,103 kWh/yr
- Summerside would produce about 1,125 kWh/yr
- Stratford would produce about 1,100 kWh/yr
- Cornwall would produce about 1,106 kWh/yr
- Montague would produce 1,087 kWh/yr
Nunavut
The average solar power system in Nunavut will produce approximately 1092 kWh of energy per kW per year.
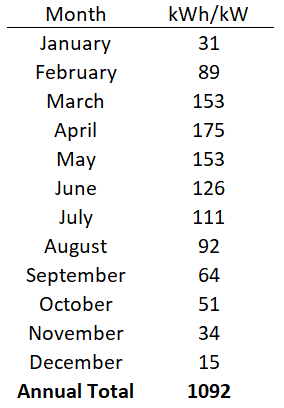

This yearly average decreases as you move north in the province and increases as you move south. For example, a 1kW solar system in:
- Iqaluit would produce about 1,057 kWh/yr
- Rankin Inlet would produce about 1,150 kWh/yr
- Arviat would produce about 1,144 kWh/yr
- Baker Lake would produce about 1,109 kWh/yr
- Igloolik would produce 999 kWh/yr
Nova Scotia
The average solar power system in Nova Scotia will produce approximately 1090 kWh of energy per kW per year.
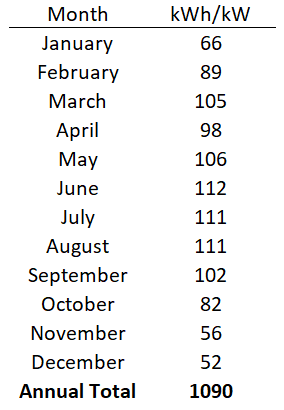

This yearly average decreases as you move north and east in the province and increases as you move south and west. For example, a 1kW solar system in:
- Halifax would produce about 1,073 kWh/yr
- Dartmouth would produce about 1,076 kWh/yr
- Truro would produce about 1,095 kWh/yr
- Amherst would produce about 1,125 kWh/yr
- New Glasgow would produce 1,081 kWh/yr
Northwest Territories
The average solar power system in the Northwest Territories will produce approximately 1064 kWh of energy per kW per year.


This yearly average decreases as you move north in the province and increases as you move south. For example, a 1kW solar system in:
- Yellowknife would produce about 1,095 kWh/yr
- Hay River would produce about 1,125 kWh/yr
- Inuvik would produce about 895 kWh/yr
- Fort Smith would produce about 1,131 kWh/yr
- Fort Simpson would produce 1,076 kWh/yr
British Columbia
The average solar power system in British Columbia will produce approximately 1004 kWh of energy per kW per year.
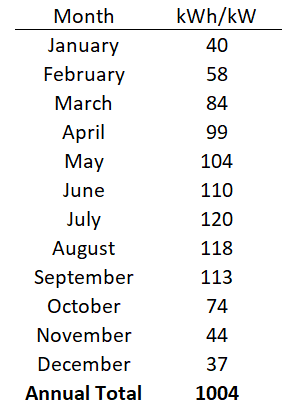

This yearly average decreases as you move north and west in the province and increases as you move south and east. For example, a 1kW solar system in:
- Vancouver would produce about 1,007 kWh/yr
- Surrey would produce about 996 kWh/yr
- Burnaby would produce about 991 kWh/yr
- Richmond would produce about 1,027 kWh/yr
- Abbotsford would produce 996 kWh/yr
Yukon Territory
The average solar power system in the Yukon Territory will produce approximately 965 kWh of energy per kW per year.
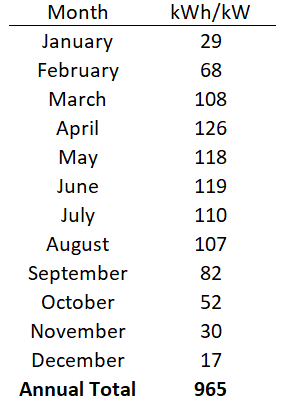

This yearly average decreases as you move east in the province and increases as you move west. For example, a 1kW solar system in:
- Whitehorse would produce about 961 kWh/yr
- Dawson would produce about 1,027 kWh/yr
- Watson Lake would produce about 947 kWh/yr
- Faro would produce about 939 kWh/yr
- Carcross would produce 953 kWh/yr
Newfoundland & Labrador
The average solar power system in Newfoundland & Labrador will produce approximately 949 kWh of energy per kW per year.
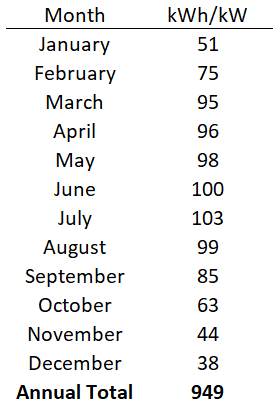

This yearly average decreases as you move south in the province and increases as you move north. For example, a 1kW solar system in:
- St. John’s would produce about 936 kWh/yr
- Conception Bay would produce about 947 kWh/yr
- Mount Pearl would produce about 933 kWh/yr
- Paradise River would produce about 977 kWh/yr
- Corner Brook would produce 950 kWh/yr
Methodology and External References
Solar production potential was calculated using the “mean daily global insolation (kWh/m2 or full sun hours (h))” in Natural Resource Canada’s photovoltaic potential and insolation dataset spreadsheet (“municip_kWh”).
- We used values for a south-facing tilt where the installation angle equals degree latitude -15°.
- A 25% efficiency loss factor was then applied before getting the final kWh/kW/yr number.
- The top five populated cities from each province were used to calculate province and territorial averages.
While the data presented on this page is accurate to three digits, the maps here are intended to be illustrative representations rather than a precise geographic information system.
NRCan has an ArcGIS web mapping application which can be used to lookup data for any municipality in Canada, and an additional list of solar resource data sources here.
Other Sustainable Resource Maps (view only)
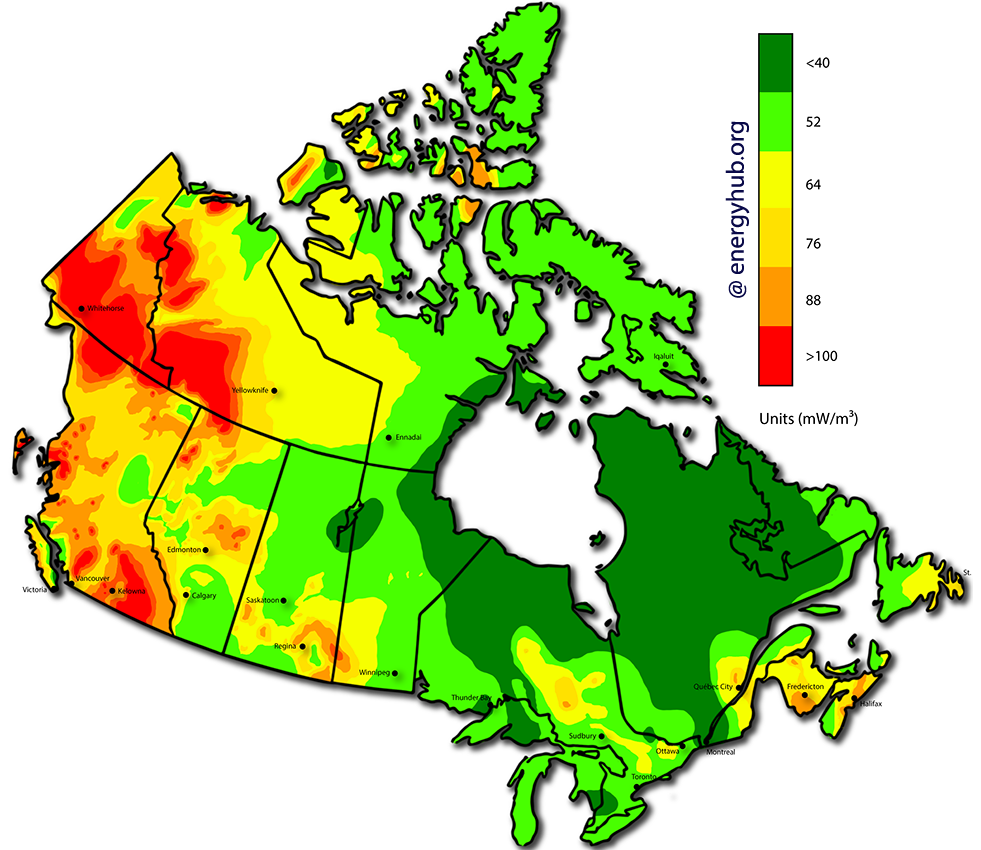
Geothermal Power
Geothermal power potential map mW/m³.
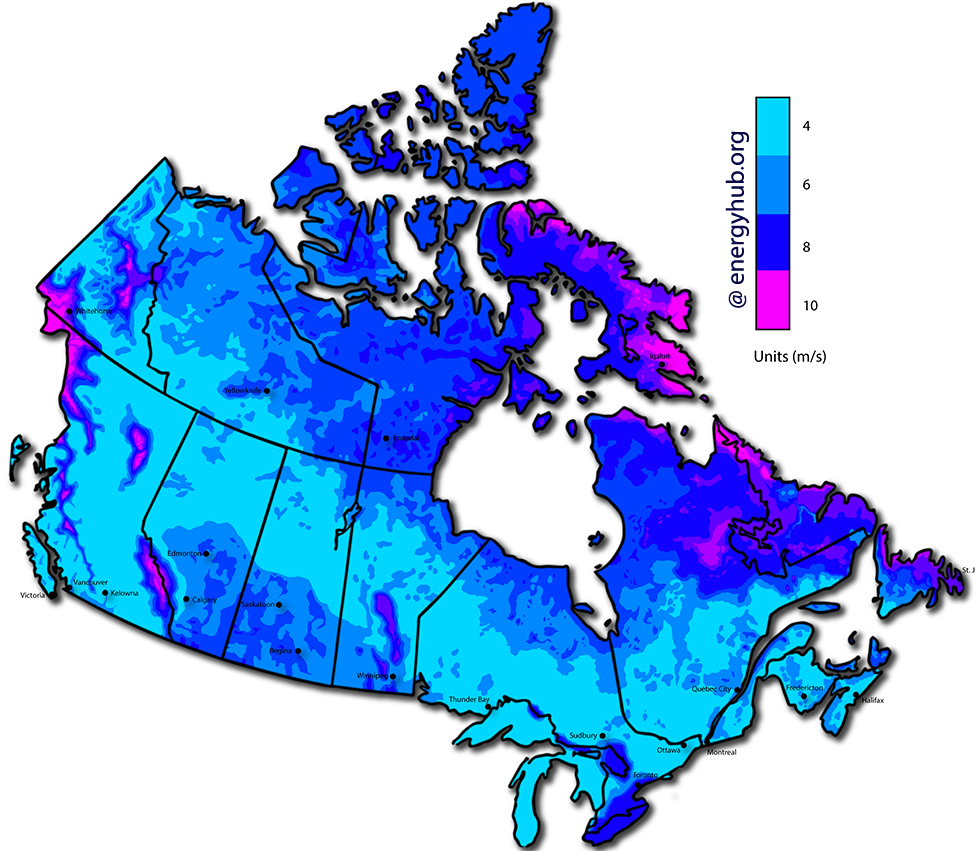
Wind Speed
Wind speed map (m/s).
More Solar Energy Reference Guides
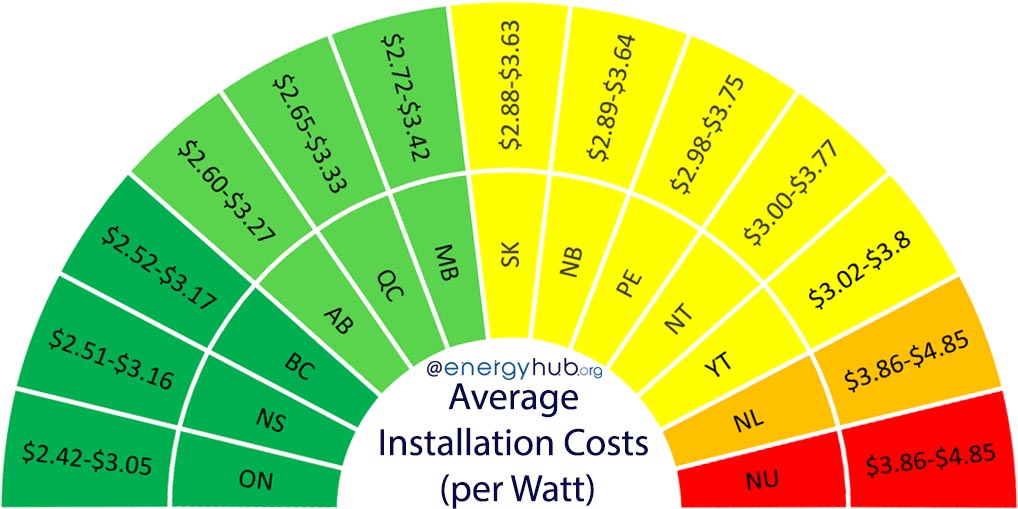
Cost of Solar Installation
Average cost of installing a solar system in every province and territory.

Provincial Solar Guides
Complete solar power guides for every province and territory.
💜 Support us by sharing this page, bookmarking it for later, or referencing us online! 💜