
Solar Power Guides & Rankings Canada 2024
Published by Rylan Urban on Jan 14, 2019. Last updated Sep 10, 2023.

Since 2018, energyhub.org has scored Canadian provinces and territories on the relative benefits that property owners can derive by installing a solar energy system.
To be clear – these rankings do not indicate which provinces are inherently better for solar (they may be less sunny or harder to access).
Rather, they indicate which provinces currently offer the most benefits to property owners based on multiple factors including sunlight levels, electricity costs, installation costs, and financing options.
Our 2023 provincial solar rankings and guides were last updated on Sep 9, 2023.
This year’s ranking factors are divided into four major categories:
Solar Incentives
Solar energy incentives continue to play a key role in making solar power feasible in many provinces.
The solar incentives category contains two ranking factors scored as indicated:
- Provincial Solar Incentive Programs /13
- Regional Solar Incentive Programs /7
- Total /20
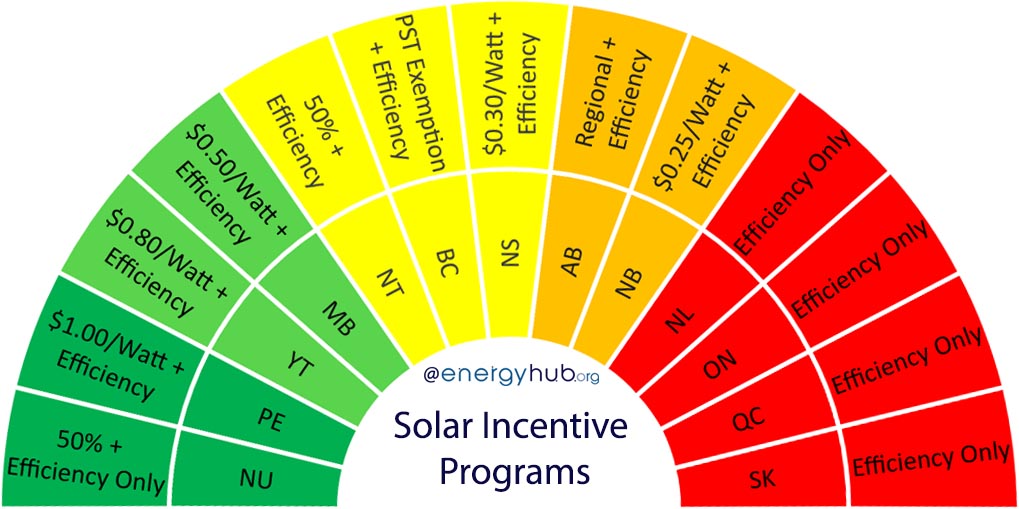
Major incentives programs – such as rebates and tax breaks – offer property owners large benefits by decreasing the total upfront system costs. Provinces earned higher scores for large provincial incentive programs.
We also consider smaller and more regional incentives, as well as incentives that only apply to certain customer classes (i.e., off-grid or non-hydro communities). These types of programs were scored lower than provincial programs.
Insights:
- Incentives continue to fluctuate across the country. Since 2019, several provincial incentives programs have been eliminated (Alberta, Saskatchewan, Quebec), reduced (Nova Scotia), or newly formed (PEI, Manitoba).
- Prince Edward Island currently has the largest solar rebate program – equal to $1.00/Watt.
- In addition to solar incentives, there is a wide variety of energy efficiency incentives that apply to most provinces. The Federal Greener Homes Grant is also available. See our Clean Energy Incentives Page for more.
- Incentives in the Northwest Territories are only accessible to off-grid and non-hydro communities. In the Yukon, incentives are only available to off-grid communities.
Do you live in Alberta, BC, Ontario, New Brunswick, Nova Scotia, PEI, or Saskatchewan and are interested in going solar? Then get a free cost estimate:
Natural Factors
The amount of energy that can be produced by a photovoltaic system is dependent on the amount of sunlight that the panels receive – more sunlight means more production potential.
The natural factors category contains just one ranking factor:
- Solar Irradiance /20
- Total /20
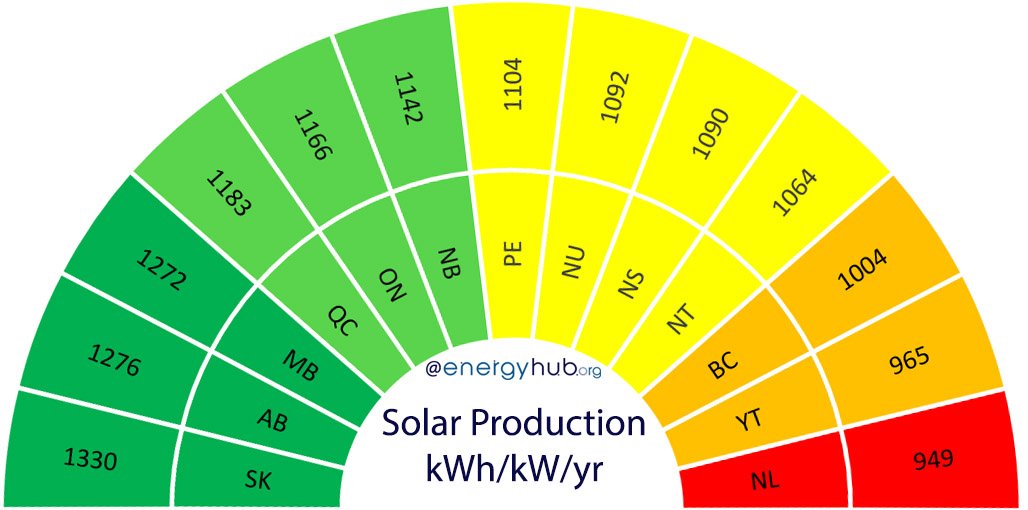
The amount of irradiance (sunlight) that a province receives determines the maximal amount of energy that a solar system can produce. Provinces with higher irradiation received higher scores.
(You can read more about solar irradiation on our Solar Maps page.)
Insights:
- Nunavut, while having the northernmost communities in our assessment, receives more annual solar irradiation than 5 other provinces and territories. This is due primarily to extremely long summer days and low cloud cover relative to Pacific and Atlantic coastal areas.
- Southern Saskatchewan, Alberta, and Manitoba receive more solar irradiation than anywhere else in Canada.
- April is the most productive month for solar power (Canada average = 122kWh/kW/mo) and December is the least productive month (Canada average = 46kWh/kW/mo).
Utility Policies
Utility-related policies play an extremely important role in making solar feasible. In many cases, such as electricity prices and net metering programs, these policies can ‘make or break’ the business case for going solar.
The utility policies category contains three ranking factors scored as indicated:
- Total Electricity Costs /10
- Interconnection Policy and Fees /10
- Rate Design /10
- Total /30
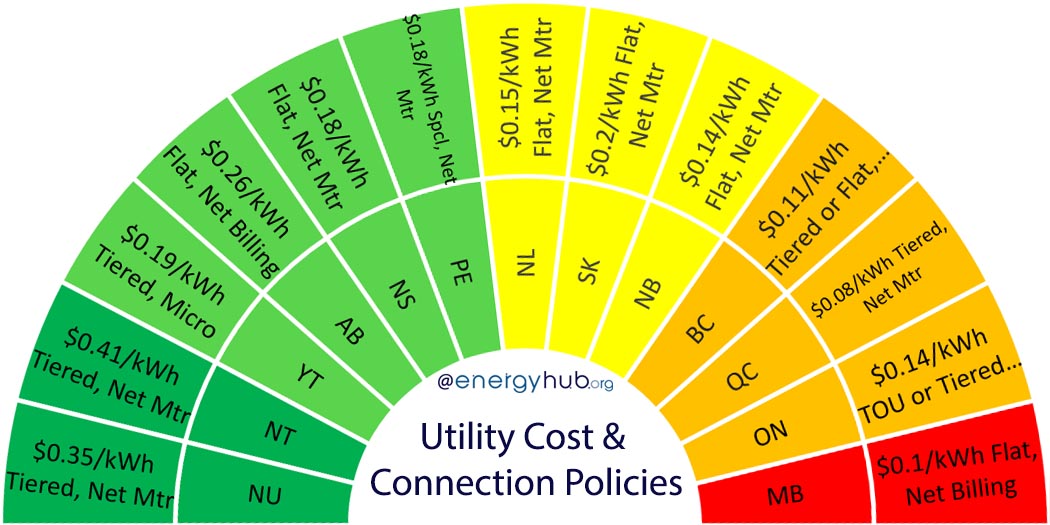
Electricity prices are important ranking factors because they determine the maximal amount of costs that can be offset by a solar energy system. Higher scoring provinces have higher electricity costs.
Interconnection policies determine what size of system can connect to the grid, as well as how and how much systems are compensated for the energy they produce. Higher scoring provinces generally allow large system sizes and compensate energy production at the full retail rate.
Utility bill rate design determines how much total electricity costs decline when energy usage declines. Higher scoring provinces have more responsive rate designs (i.e., reducing your electricity usage in kWh by 50% yields at least a 50% reduction in your electricity bill).
(You can read more about electricity prices and rate design on our Electricity Prices page.)
Insights:
- There is a net metering, net billing, or micro-generation available for property owners in every province and territory. This means that connected a system to the grid is almost always an option.
- All provinces credit system-generated energy at the retail rate except for:
- Saskatchewan – electricity is purchased at $0.075/kWh, about half the retail electricity rate. (But City of Saskatoon residents still receive the retail rate)
- Manitoba – electricity is purchased at $0.06546/kWh, about 65% of the retail rate.
- The cheapest electricity appears to be in provinces where hydro and nuclear sources are abundant: Quebec, Manitoba, British Columbia, New Brunswick, and Ontario.
- The highest fixed electricity costs appear to be in provinces with competitive energy markets: Alberta ($45/mo) and Ontario ($32/mo). Saskatchewan is the only exception – a monopoly market where fixed costs are also relatively high ($32/mo).
System Financing
System financing is an extremely important consideration for people who are switching to solar power – especially in terms of upfront system costs and financing options.
The system financing category contains three ranking factors scored as indicated:
- Cost of Installation /15
- PACE Financing /10
- Other Financing Options /5
- Total /30
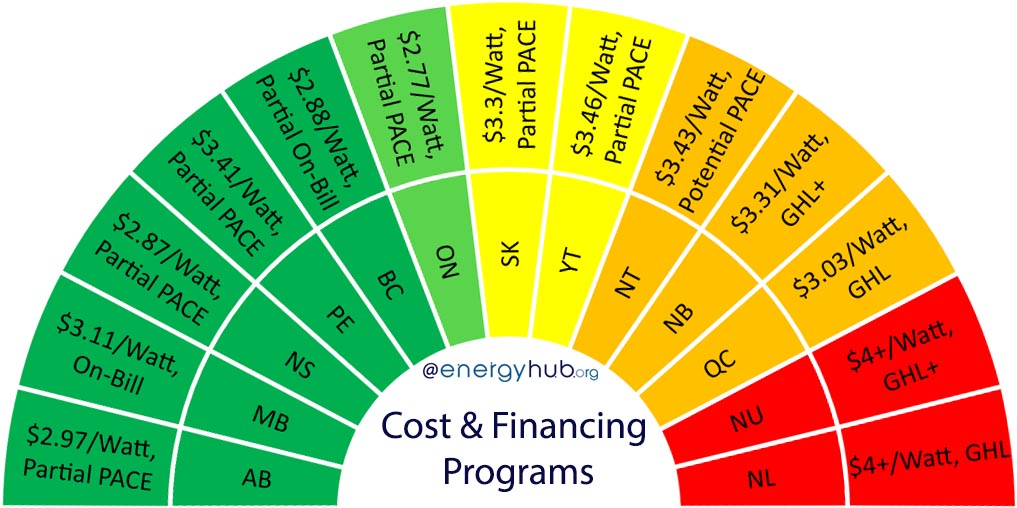
Upfront cost of installation remains a primary barrier for many property owners. Provinces scored higher when upfront costs were lower.
Property assessed clean energy (PACE) is an innovative financing option that allows you to repay your system costs through your property tax. Higher scoring provinces had these programs available to use for solar system installation.
Loans that are specifically intended for clean energy projects make it easier for homeowners to switch to solar. Provinces that had these options scored higher.
(You can read more about upfront costs on our Cost of Solar Power page.)
Insights:
- PACE and on-bill financing programs exist in many provinces, but is implemented to highly varying degrees.
- PACE exists in Nova Scotia (much of province), Ontario (some of province), Alberta (some of province), Prince Edward Island (some of the province), Saskatchewan (some of province), Yukon (special coverage), and the Northwest Territories (incoming).
- On-Bill financing exists in Manitoba (full province) and British Columbia (some of province, but not for solar).
- The average installation cost in Canada (before tax and rebates) is $3.34/Watt with the lowest priced province being Ontario ($2.42-$3.05/watt) and the highest priced being Nunavut and Newfoundland and Labrador ($4.00+/watt). Average costs have increased from $3.01/Watt in 2021.
Complete Solar Power Guides
(click on your province below to access your province’s solar guide)
Do you live in Alberta, BC, Ontario, New Brunswick, Nova Scotia, PEI, or Saskatchewan and are interested in going solar? Then get a free cost estimate:
💜 Do you support sustainable energy? Take action, comment below, or share this page! 💜