Sustainable Energy Facts Canada 2024
Published by Rylan Urban on December 22, 2020. Last updated Sep 9, 2023.
This page is a growing collection of sustainable energy facts based on energy, emissions, and economic data from the Canadian Energy Regulator (CER) and Environment and Climate Change Canada (ECCC).
Explore our Canadian sustainable energy data indicators by clicking on your preferred category below:
Canada-Wide Energy Intensity
[wpdatachart id=6]
In 2020, Canada had an energy intensity of 6.75 MJ per dollar of GDP*, or 97MWh per person.
Energy intensity measures how much energy is required to produce a useful economic product ($GDP), or how much energy is required to meet Canada’s standard of living demands (pop).
It is calculated by taking the total amount of primary energy demanded across the country and dividing it by either GDP or population. Energy intensity is often expressed in units of MJ per $GDP or MWh per person.
*On this page, GDP refers to real gross domestic product, adjusted to 2012 Canadian dollars.
Canada-Wide Emissions Intensity
[wpdatachart id=7]
In 2020, Canada had an emissions intensity of 0.354 tCO2e* per $1,000 GDP, or 19.68 tCO2e per person.
Emissions intensity measures the total amount of greenhouse gas emissions released per unit of economic activity ($1,000 GDP), or the total amount of greenhouse gas emissions released per person (pop).
It is calculated by taking the total amount of greenhouse gas emissions released and dividing it by either gross domestic product or population. Emissions intensity is often expressed in units of tCO2e per $1,000 GDP or tCO2e per person.
*On this page, greenhouse gas emissions refer to “tonnes of carbon dioxide equivalent” (tCO2e).
Interested in viewing absolute emissions? Then head over to our Clean Energy Targets page!
Canada-Wide Low-Carbon Energy
[wpdatachart id=11]
In 2020, Canada met 24.34% of its primary energy demand from low carbon resources*. Canada also produced 83.01% of its electricity from low carbon resources.
*On this page, we refer to biomass, geothermal, hydro, landfill gas, nuclear, solar, tidal, wave, and wind as low-carbon resources.
Canada-Wide Electrification
[wpdatachart id=8]
In 2020, Canada met 16.51% of its total end-use energy demand and 0.163% of its end-use transportation energy demand by electricity.
Electrification measures the total amount of end-use energy demand, either economy-wide or within the transportation sector, that is met by electricity.
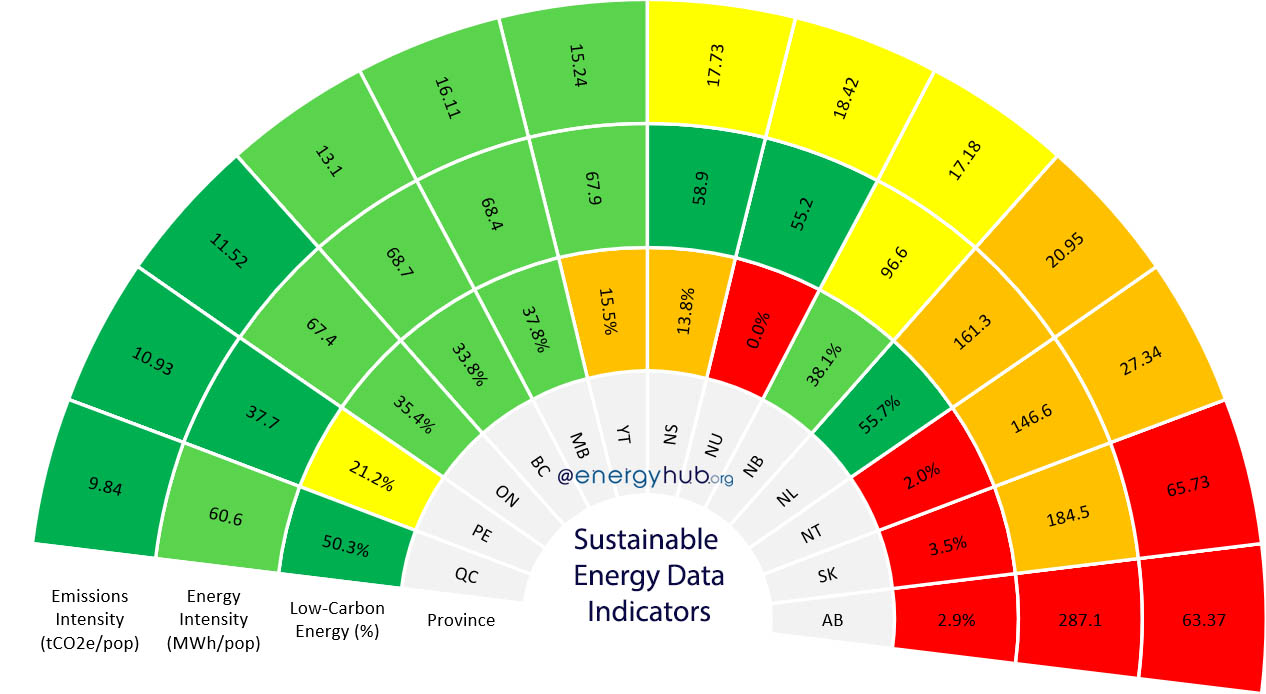
Provincial Sustainable Energy Data Indicators
Energy Intensity by GDP
[wpdatachart id=3]
In 2020, Alberta had the highest energy intensity by GDP in Canada, using 14.25 MJ of primary energy for every dollar of GDP generated. By contrast, Nunavut had the smallest energy intensity by GDP, requiring just 2.5 MJ of primary energy for every dollar of GDP generated.
Energy Intensity by Population
[wpdatachart id=2]
In 2020, Alberta had the highest energy intensity by population in Canada, using 278.1 MWh of primary energy for every person in the province. By contrast, Prince Edward Island had the smallest energy intensity by population, requiring just 37.7 MWh of primary energy for every person in the province.
Emissions Intensity by GDP
[wpdatachart id=5]
In 2020, Saskatchewan had the highest emissions intensity by GDP in Canada, releasing 0.883 tCO2e for every dollar of GDP generated. By contrast, Quebec had the smallest emissions intensity by GDP, releasing just 0.209 tCO2e for every dollar of GDP generated.
Interested in viewing absolute emissions? Then head over to our Clean Energy Targets page!
Emissions Intensity by Population
[wpdatachart id=4]
In 2020, Saskatchewan had the highest emissions intensity by population in Canada, releasing 65.73 tCO2e for every person in the province. By contrast, Quebec had the smallest emissions intensity by population, releasing just 9.84 tCO2e for every person in the province.
Low-Carbon Primary Energy
[wpdatachart id=12]
In 2020, Newfoundland and Labrador had the highest degree of low-carbon energy in Canada, meeting 55.68% of their primary energy demand from low-carbon resources. In contrast, Nunavut had the lowest degree of low-carbon energy, meeting just 0.04% of their primary energy demand from low-carbon resources.
Low-Carbon Electricity Generation
[wpdatachart id=13]
In 2020, Manitoba had the highest degree of low-carbon electricity generation in Canada, generating 99.95% of their electricity from low-carbon resources. In contrast, Nunavut had the lowest degree of low-carbon electricity generation, generating 0% of their electricity from low-carbon resources.
Economy-Wide Electrification
[wpdatachart id=9]
In 2020, Quebec had the highest degree of economy-wide electrification in Canada, meeting 36.52% of its total end-use energy demand from electricity. By contrast, the Northwest Territories had the lowest degree of economy-wide electrification, meeting just 4.72% of its total end-use energy demand from electricity.
Electrification of Transportation
[wpdatachart id=10]
In 2020, Quebec had the highest degree of transportation electrification in Canada, meeting 0.302% of its total end-use transportation energy demand from electricity. By contrast, the Northwest Territories, Nunavut, and the Yukon Territory met 0% of their total end-use transportation energy demand from electricity.
More Clean Energy Reference Guides

Electricity Prices Canada
Average total electricity costs for every province and territory.
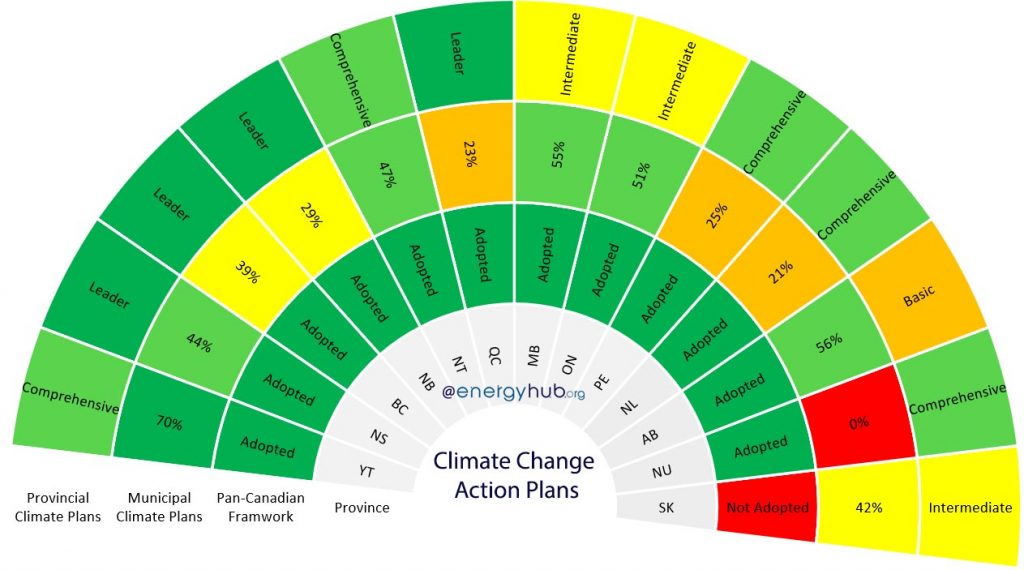
Climate Action Plans
A database of national, provincial, and municipal climate action plans.
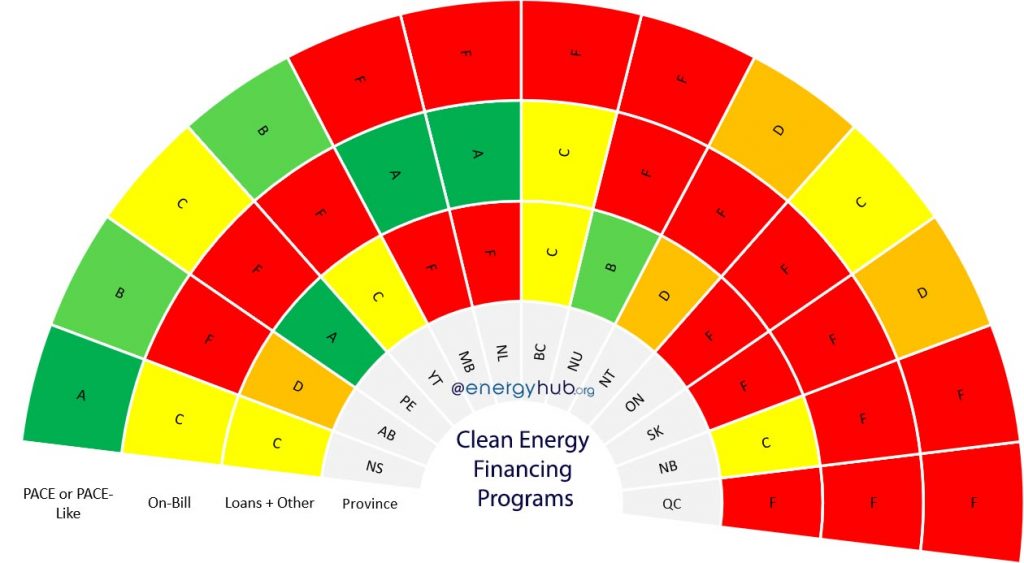
Clean Energy Financing
Complete list of clean energy financing programs sorted by province.
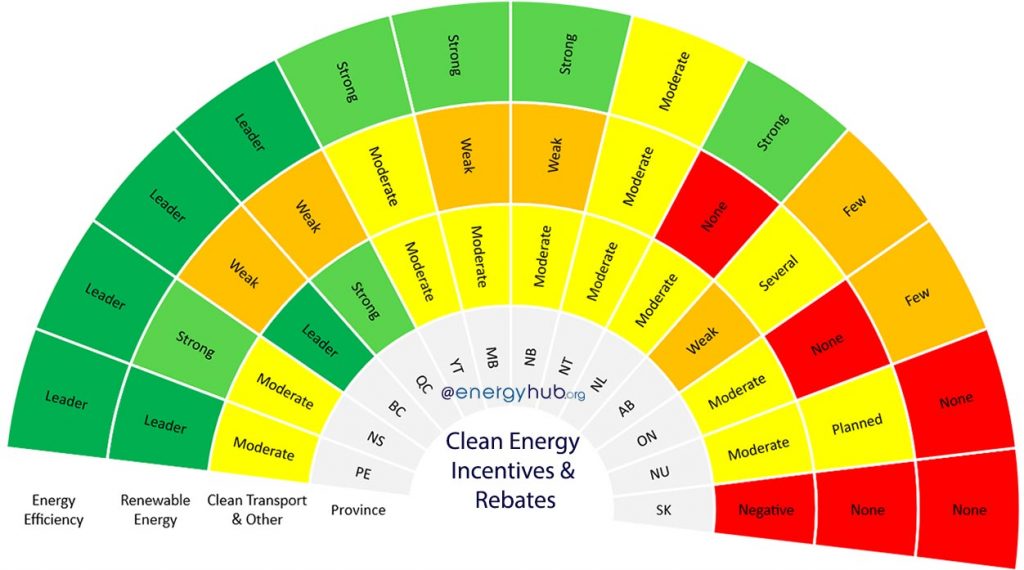
Clean Energy Incentives
Complete list of clean energy programs and incentives sorted by province.
💜 Support us by sharing this page, bookmarking it for later, or referencing us online! 💜